The Science Behind Climate Change
There are several heat-trapping ‘greenhouse gases’ that contribute to climate change. Carbon Dioxide (CO2) is currently the highest priority to reduce as it puts us at the greatest risk of irreversible changes if it continues to accumulate.
Other gases have more potent heat-trapping ability than CO2 (e.g. methane), but are simply far less abundant in the atmosphere. CO2 also sticks around. It remains in the atmosphere longer than the other major heat-trapping gases emitted as a result of human activities.
Carbon Dioxide (CO2) occurs naturally on earth and without human intervention, there is a “Carbon Cycle.”
Trees and plants break down in the soil which creates CO2.
Soil releases CO2 into the atmosphere, along with animals breathing and volcanoes erupting.
Trees and plants, large bodies of water and rocks absorb CO2.
This process has been delicately balanced for hundreds of thousands of years, and theoretically could go on indefinitely without human intervention.

This is all that CO2 is! 2 Oxygen atoms and 1 Carbon atom.

When you introduce post-industrial human activities into the equation, things start to go wrong.
Humans drill for fossil fuels, which after combustion release carbon dioxide into the atmosphere.
This carbon dioxide has been happily sitting in the ground for millions of years not bothering anyone.
Human activity is also responsible for deforestation at a massive scale, often to make way for intensive food production.
Therefore, we are releasing more CO2 into the atmosphere whilst at the same time removing the very thing that can absorb it.
This is an unsustainable cycle and out of balance with nature.
The Greenhouse Effect
On 18 May 1859, the Irish physicist John Tyndall discovered the heat trapping effect of Carbon Dioxide. This is not new science!
Please watch this video which explains the greenhouse effect in detail. (Published in 2016)
Weather vs Climate
When talking about climate change, it’s important to understand that weather and climate are 2 different things.
Weather is the short term state of the atmosphere, for example one moment it’s raining, another moment it’s sunny.
Climate is the long term state of the atmosphere in a particular region and the average weather pattern for that region.
For example, The UK is classed as a “temperate oceanic climate” which generally means cool summers (relative to latitude) and cool but not cold winters, with a relatively narrow annual temperature range and few extremes of temperature.
Climate change is upsetting this climate, with more extreme weather and temperatures.
Greenhouse Gases
Carbon Dioxide isn’t the only greenhouse gas. Going from the least potent to the most potent, they are:
Methane (CH4) – Sources include natural gas and cattle. Contrary to popular belief, the methane usually comes from the front end of the animal chewing the cud, not the rear end!
Nitrous Oxide (N2O) – Natural sources include soils under natural vegetation and atmospheric chemical reactions, but non natural sources include diesel engines and burning biomass.
Chlorofluorocarbons (CFCs) and Hydrofluorocarbons (HCFCs) – There are no natural sources of CFCs or HCFCs, but they were used in aerosols, fridges and air conditioning units. CFCs were banned in 1996, and HCFCs were banned in 2001 due to the damage they did to the ozone layer, as well as being greenhouse gases.
Sulphur Hexaflouride (SF6) – There are no natural sources of Sulphur Hexafluoride but it does have some very specific industrial applications such as being used in high voltage switchgear (SF6 is a very good electrical insulator).
Please watch this video on which Greenhouse Gas is worst for more information on global warming potentials.
(Published in 2018)
Famously, Nike used SF6 in its bubble for the Nike Air trainer from 1989 to 2006. The table below will hopefully tell you how bad an idea it was to use it!
Note – When comparing greenhouse gases to each other for Carbon Footprint reporting, everything is related back to CO2, and therefore you will see the term “CO2e” (or Carbon Dioxide Equivalent). This is just a way of saying that something has the equivalent global warming potential as releasing (x) amount of CO2.
For example, 1kg of Sulphur Hexafluoride is approximately 22.8 tCO2e (tonnes, Carbon Dioxide equivalent).

Global Warming vs Climate Change
There’s quite a lot of terminology around the science of climate change and global warming, but what does it actually mean? For example, global warming and climate change are terms that are often used interchangeably, but they’re actually very different things.
Global Warming is defined as “The long-term heating of Earth’s climate system observed since the pre-industrial period (between 1850 and 1900) due to human activities, primarily fossil fuel burning, which increases heat-trapping greenhouse gas levels in Earth’s atmosphere”.
Climate Change is defined as “A long-term change in the average weather patterns that have come to define Earth’s local, regional and global climates”.
At its most basic, Global Warming is the earth getting warmer, Climate Change is the changes in weather because of the earth getting warmer.
More information on global warming vs climate change can be found here.
What’s our current trajectory?
If we carry on as we are, burning fossil fuels and increasing deforestation, how much higher are we expecting the global temperature to rise?
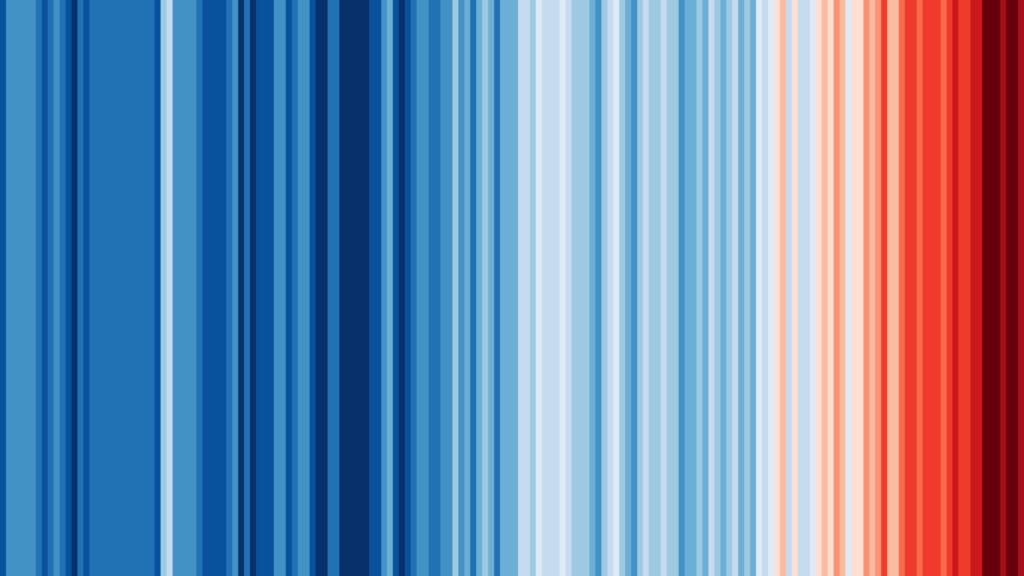
The image below is of Warming Stripes by Professor Ed Dawkins, and gives a graphical representation of how global average temperatures have risen over nearly two centuries.
Each stripe represents the average temperature for a single year, relative to the average temperature over the period as a whole. Shades of blue indicate cooler-than-average years, while red shows years that were hotter than average. The stark band of deep red stripes on the right-hand side of the graphic show the rapid heating of our planet in recent decades.

Below is an expanded Warming Stripes with projections of the future, created by engineer Alexander Radtke.
At the bottom is our current path – with emissions carrying on as they are, we could hit 4.8°C by the end of the century, before eventually hitting +7.8°C by the year 2200. The sea level rise caused by 4°C of warming alone will make approximately half a billion people homeless.
We need to be moving towards the top trajectory, which means a significant increase in climate action.
At its most basic, Global Warming is the earth getting warmer, Climate Change is the changes in weather because of the earth getting warmer.
More information on global warming vs climate change can be found here

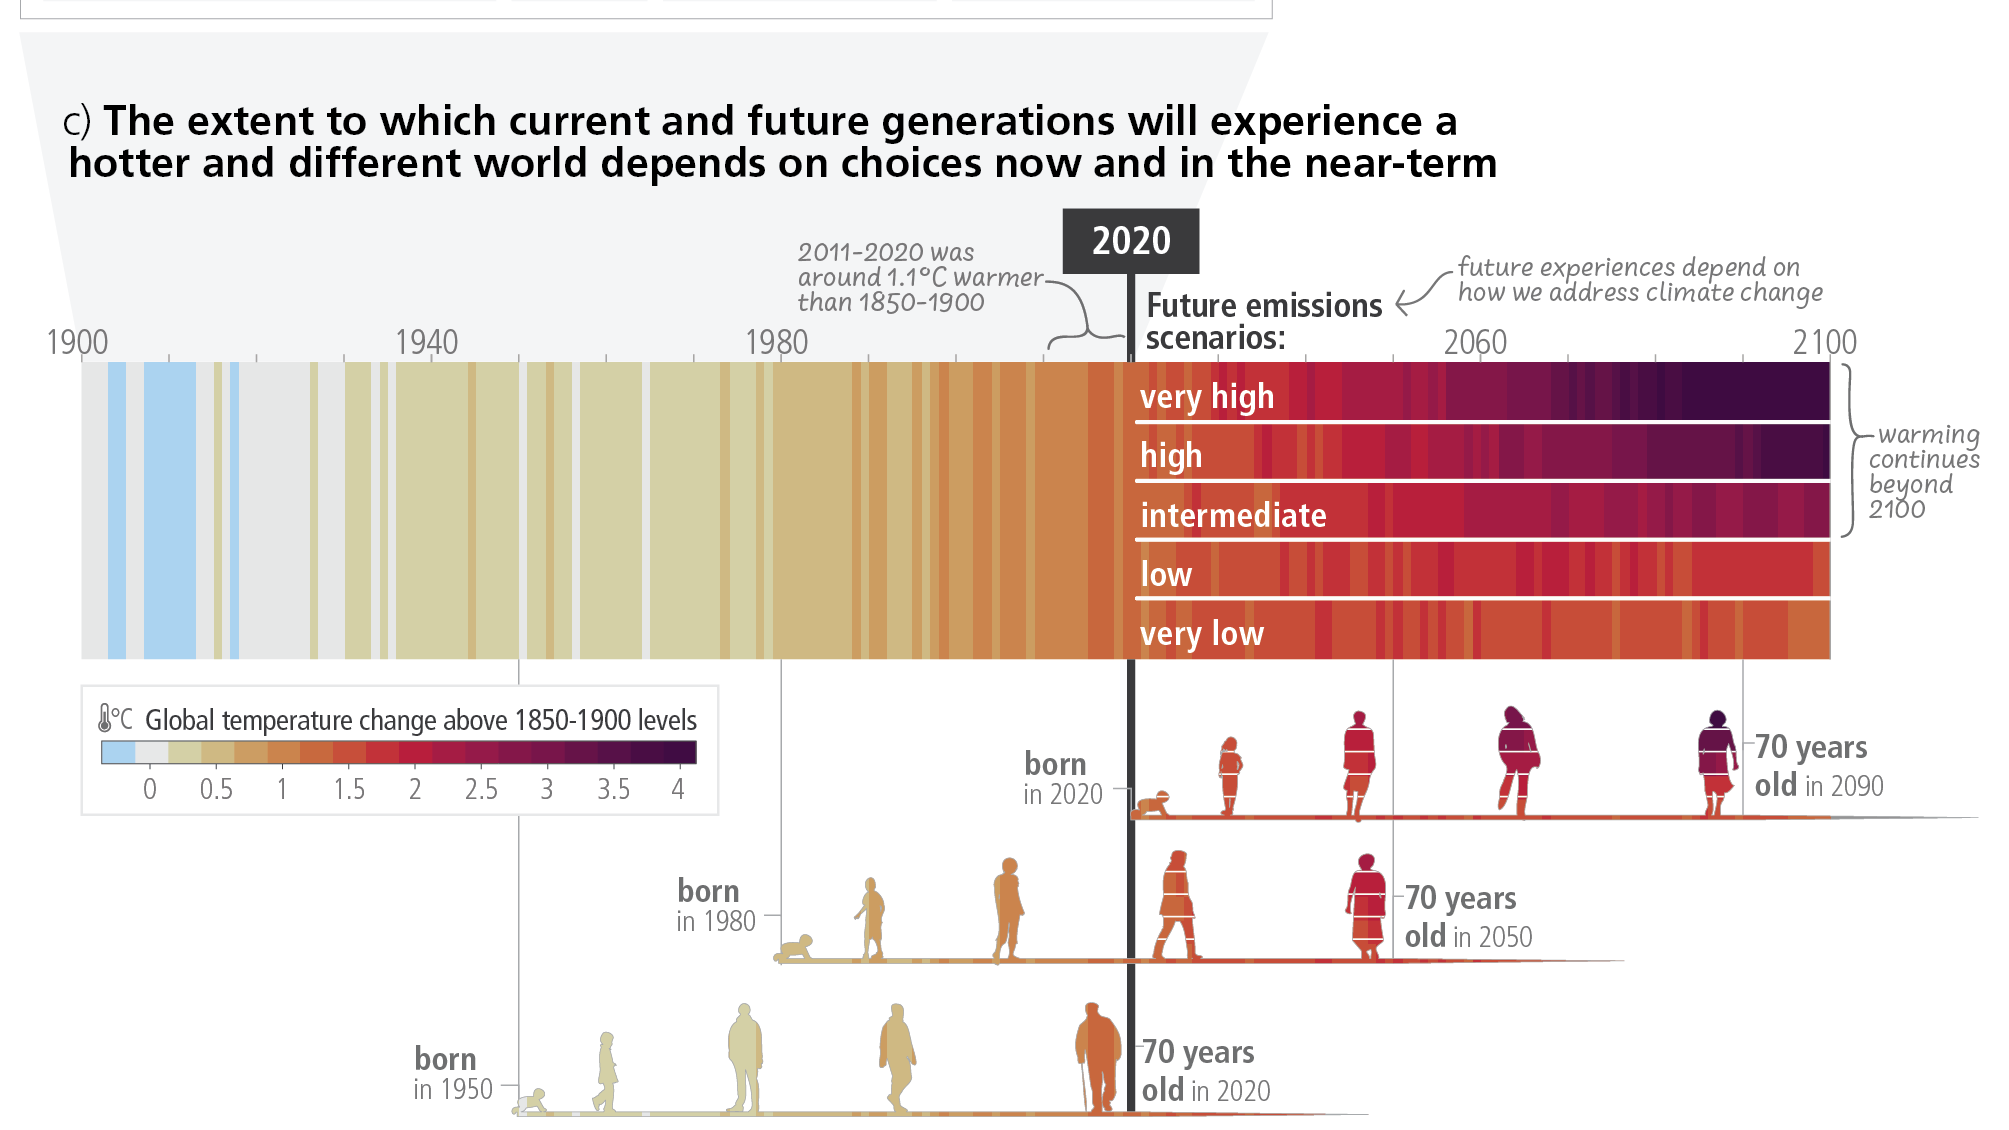
The Warming Stripes were featured in a recent report by the Intergovernmental Panel on Climate Change (IPCC). The version below shows the extent to which current and future generations will experience a hotter and different world, depending on the choices we make now and in the near-term. We can see that children born in 2020 could be living in a world that is 4°C degrees warmer by the time they are 70.
Our children will never experience a childhood as cool as ours. And our childhood wasn’t that cool. Each generation is born into an ever-warmer world.

Biodiversity Stripes
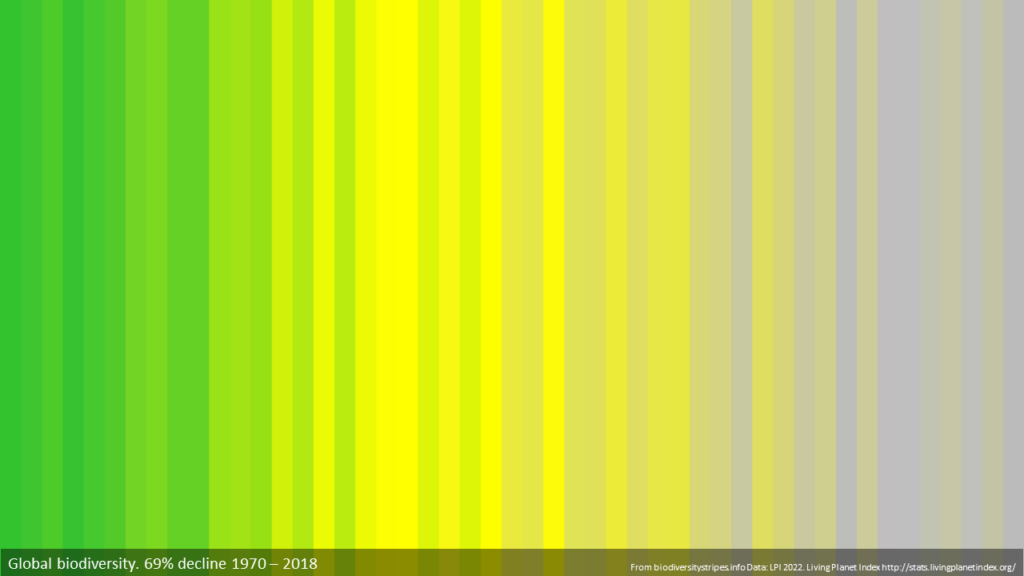
The Warming Stripes concept has also been used to create Biodiversity Stripes (by Prof. Miles Richardson), which illustrates the Living Planet Report’s findings: the population of mammals, birds, fish, amphibians and reptiles has seen an average decline of 69% globally since 1970.
The decline of wildlife is a loss of vibrancy and colour, the green becomes grey. So, the global stripes start green in 1970 and turn grey as we enter the 2000s.
The staggering rate of decline is a severe warning that the rich biodiversity that sustains all life on our planet is in crisis, putting every species at risk – including us.

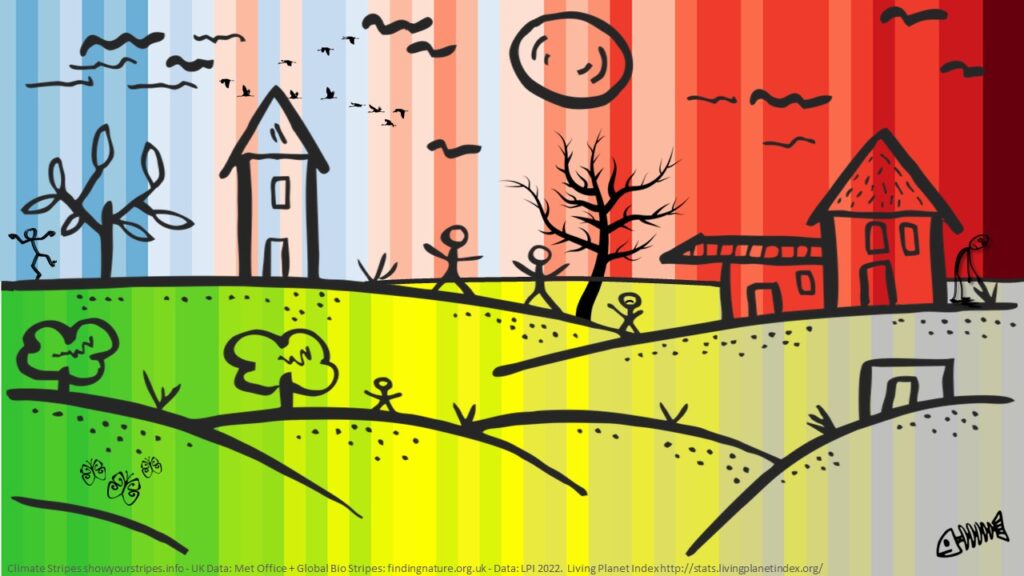
When our world turns hot and grey, so do we. Below are some stripes representing the heating of the planet and global loss of biodiversity since 1970 combined.

The Science Quiz
Now that you’ve completed this section, please complete this short quiz before moving on. The link to move on to the next section will appear once you have completed the quiz.
