What’s the impact?
So it gets warmer? Great!
Who doesn’t love sunny days?
Unfortunately, it’s not as simple as that. Whilst there is the possibility that some days will get warmer, an increase in the global average temperature will have knock on effects on other aspects of the climate.
For example, more water evaporating due to higher temperatures will increase the amount and intensity of rainfall. This could lead to flooding, as well as droughts. This will have a knock on effect on the food chain which requires a stable climate to grow.
A Hotter World
So it gets warmer? Great!
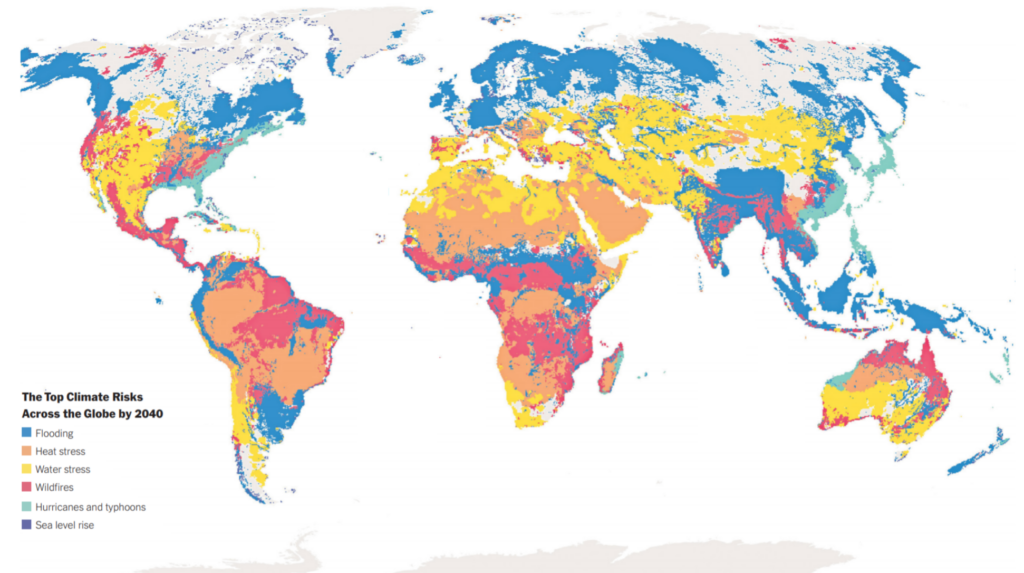
Nobody knows for certain what a hotter world will look like, but the map below is one model
This Global Climate Risks map shows which areas could be at high risk unless greenhouse-gas emissions are cut drastically. This model is by Four Twenty Seven, a company that analyses climate risks, for The New York Times. You can see climate risks around the world here.
Worldwide, roughly 90 percent of the population will be exposed to one or more threats.
The highest ranked climate risk for each region is the statistic shown on the map. The colour of the region indicates which climate risk – flooding, heat stress, water stress, wildfires, hurricanes and typhoons and sea level rise, is ranked first for the region. The region is marked with the corresponding colour for the greatest risk. Other risks are not noted. For example, the largest risk in California is wildfires. These are caused, in part, by water and heat stress, which is not noted on the map. Globally, wildfire risk regions are usually adjacent to water stress and heat stress areas.
Heatwaves, which caused 91 percent of extreme temperature deaths in the past two decades, will be especially pronounced in Africa, where almost one billion people face a high risk of heat stress.
Northern parts of South America will be another densely populated area threatened by extreme heat. In Colombia and Venezuela, more than 90 percent of the population will be exposed. So will their crops.
In the United Kingdom in 2040, the major climate hazard may be flooding. Some parts of the United Kingdom might also be exposed to high risk of sea level rise.
Areas across the globe are at risk of becoming uninhabitable to humans due to desertification, floods, droughts and other extreme weather. Global challenges require a global response.
The Impact of Climate Change on the UK
The UK has already begun to be affected by climate change. According to the committee on climate change (CCC):
- The average sea level has already risen by around 16cm in the last 100 years and could increase by 8 to 115cm by the end of the 21st century (compared to the 1981-2000 average) depending on location and future greenhouse gas emissions.
- Average temperatures in England over the last decade (2008-2017) were around 0.8°C higher than they were in the 1970s and 1°C higher than pre-industrial times (1850-1900)
- Extremely wet days are increasing.
On 19th July 2022, along with the rest of the UK, Oxford saw its hottest day ever, with temperatures reaching 41°C. The average maximum temperature locally this time of year is 23°C. The extreme heat saw the Met Office issue the first ever Red warning for exceptional heat, and local businesses and organisations were forced to close.
The previous night, between 18 and 19 July 2022, the UK experienced its highest recorded minimum night time temperature of 26.8 °C at Shirburn Model Farm, here in Oxfordshire.
In August 2022, drought left residents of Northend village on the Oxfordshire, Buckinghamshire border without running water.
Climate Change is not a distant and far away thing that affects other people, it is happening right here, right now and without an increase in climate action, things are only going to get worse.
Please watch the video, which is all about the village of Fairbourne in Wales which is already planning to be abandoned due to rising sea levels.

But what about the summer of 1976?
The 1976 British Isles heat wave led to the second hottest summer average temperature in the UK since records began. At the same time, the country suffered a severe drought. It was one of the driest, sunniest and warmest summers (June/July/August) in the 20th century, although the summer of 1995 is now regarded as the driest. Only a few places registered more than half their average summer rainfall.
Below are 2 images from NASA’s Goddard Institute for Space Studies (GISS,. These are heat maps of the world showing the variations on the average temperature for that place at that time of year. In the Summer of 1976, you can see that the temperature is approximately 2 degrees warmer in the UK than it should be for that time of year. Also, take note of the scale at the bottom which goes from -4.4 to 4.1 degrees.
Now compare this heat map to the map from the Summer of 2020. Again, the UK is between 2 and 4 degrees hotter, but so is much of the rest of the world. What is especially scary is that the scale at the bottom of the image has changed to -4.1 to 4.4 degrees!


Floods
According to the United Nations, water is the primary medium through which we will feel the effect of climate change, both through flooding and droughts.
Many scientists are predicting that the amount of rainfall will increase as the global average temperature increases. This is due to 2 factors:
- As the air temperature increases, its capacity to hold water increases. According to the Clausius-Clapeyron equation, for every 1 degree Celsius that the temperature increases, the air can hold 7% more water. Therefore, a world that is 4 degrees warmer than the pre-industrial era would have around 28% more water vapour in the atmosphere.
- Increased heat leads to higher levels of evaporation and drying, increasing the amount of water vapour.
Oxford has a long history of flooding. Significant floods in past decades have caused property damage to homes and businesses and closed the railway and major roads, bringing the city to a standstill. Since 2000 there have been 7 floods that caused property flooding. For those that experienced the floods of 2003, 2007 or 2013/2014, the disruption will be memorable. Floodwater cut off Botley and Abingdon Roads, closed the railway line and caused devastation to many homes and businesses.
Recent high river flows in 2020 and 2021 were a reminder of how vulnerable many homes are, with floodwater kept at bay by temporary barriers and pumps. These floods of recent decades have been nowhere near the scale we expect in coming years due to climate change. It is only a matter of time before Oxford sees a major flood again, of a size last experienced in 1947.
During these floods in 1947:
- There were record breaking river levels
- 3000 homes were flooded
- Medley Bridge on Port Meadow was swept away
This was rare, and considered exceptional back then. There were fewer flood defences, as flooding was not as common as it is today.
More data on rainfall predictions can be found in this Carbon Brief article


Droughts
It may seem odd that Global Warming and Climate Change can cause droughts as well as floods. This is because, although air can hold more water vapour as it gets warmer, the water will not fall as rain evenly around the globe. Generally speaking, areas which currently have rain can expect more of it, areas which get little can expect less of it.
Warmer temperatures can enhance evaporation from soil, making periods with low precipitation drier than they would be in cooler conditions. Droughts can persist through a “positive feedback,” where very dry soils and diminished plant cover can further suppress rainfall in an already dry area. A changing climate can also alter atmospheric rivers (narrow streams of moisture transported in the atmosphere), which can especially disrupt precipitation patterns. A combination of shifting atmospheric rivers and warmer temperatures can also affect snowpack and melt, potentially devastating the water supply.
Agriculture: Droughts affect livestock and crops, including cornerstone commodities like corn, soybeans, and wheat. At the height of the 2012 drought, the U.S. Department of Agriculture declared a natural disaster over 2,245 counties, 71 percent of the United States. Globally, drought struck several major breadbasket regions simultaneously in 2012, adding to food price instability. In countries already facing food insecurity, cost spikes can lead to social unrest, migration, and famine.
Transportation: Droughts can affect water levels on rivers of commerce like the Mississippi. Transport barges need at least nine feet of water, and to maintain this level, the U.S. Army Corps of Engineers had to blast, dredge, and clear obstructions on a key stretch of the Mississippi in 2013. Also, drought and heat can buckle roadways. A 2011 drought in Texas caused $26 million in pavement damage.
Wildfires: Drought conditions and record heat have fuelled damaging and sometimes deadly wildfires in the U.S. West. Millions of forested acres and thousands of homes have been lost over the past decade due to fires thriving in dry, stressed forests and the proximity of communities to fire-prone forests. The video below on the California wildfires explains in more detail just how droughts and global climate change can increase the frequency and sizes of wildfires.
Energy: Droughts can raise concerns about the reliability of electricity production from plants that require cooling water to maintain safe operations. Hydroelectric power may also become unavailable during droughts. When heat waves coincide with droughts, electricity demands can grow, compounding stress on the grid.
Please watch the video on the California wildfires, and how climate change is making the problem worse.
Species Extinction
Many scientists now believe that humans are responsible for the 6th mass extinction event on earth, the 5th being the Cretaceous–Paleogene extinction event 66 million years ago. The most famous victim of this event being the Dinosaurs. As the climate changes and habitats are destroyed, more and more animals are being pushed towards extinction, in fact 1 report states that humans are responsible for wiping out 60% of animal populations since 1970.
One study published in the Proceedings of the National Academy of Sciences eschews the normally sober tone of scientific papers and calls the massive loss of wildlife a “biological annihilation” that represents a “frightening assault on the foundations of human civilisation.”
Please watch this video from the BBC about species extinction and how climate change is accelerating it.
Pandemics
Zoonotic pathogens (animal pathogens that are transmitted to humans) make up 60% of human infectious diseases. Wild animal host species sustain parasite (e.g. virus) cycles when they are not infecting humans, and serve as a source of infection and potential reinfection of humans. Bats in particular are “reservoir hosts” for these viruses, and are believed to be the route in which SARS-COV-2 infected humans.
Deforestation and intensive farming practices push human populations and wild species closer together, increasing the chances of a Zoonotic pathogen making the jump to humans.
The video explains in detail how deforestation is helping diseases such as Covid-19 spread, and an article here explains in more detail how deforestation is driving the emergence of novel coronaviruses.
Is everything lost?
No! We still have time to fix this. The IPCC report stated that we have until 2030 to “lock in” the changes we need to make to bring about the maximum 1.5°C rise, but this would require “Rapid, far reaching and unprecedented changes in all aspects of society.” Effectively, we have 7 years to turn this situation around.
We are the last hope to fix this.
If we start acting now, we can:
- Avoid an estimated 2.4 million premature deaths from outdoor air pollution annually by 2030
- Prevent as much as 52 million tonnes of crop losses per year
- Slow the increase in near-term global warming by as much as 0.6°C by 2050
- Save over 1 million species from extinction
- Prevent climate tipping points that can exacerbate long-term climate impacts and make adapting to climate change harder, especially for the poor and most vulnerable
There are also so many co-benefits to taking action:
- Better air quality = Less NHS costs
- Less NHS costs = More money available for better transport systems, cleaner energy infrastructure, more energy efficient homes
- More efficient homes = Less energy wasted
- Less energy wasted = Less energy needed
- Less energy needed = …
The list goes on and on!
However, we have to start acting now.
And if you aren’t already convinced that climate change is real and we have to act, please have a look at the cartoon below. Even if all of the scientists are wrong and we’re not heading towards a climate catastrophe, what do we have to lose by acting? Isn’t having energy independence, cleaner air and liveable cities worth fighting for anyway?

Thank you for completing part 1!
In order to continue with your training you will need to complete part 2 with our Carbon Literacy trainer. In these sessions you will learn about:
- The UK’s net zero roadmap and what this means
- What is already happening at a national, local and sectoral level
- What we can do as individuals
- What we can do as organisations
If you haven’t already received a Zoom link to the training session, please contact us below.